KiwiSaver Fees vs Australia and the UK: What Deloitte Found
Deloitte finds KiwiSaver fees now just below Australia's. Across all 396 funds, the finding holds, and the higher fees sit in the long tail.

Rajat Vats
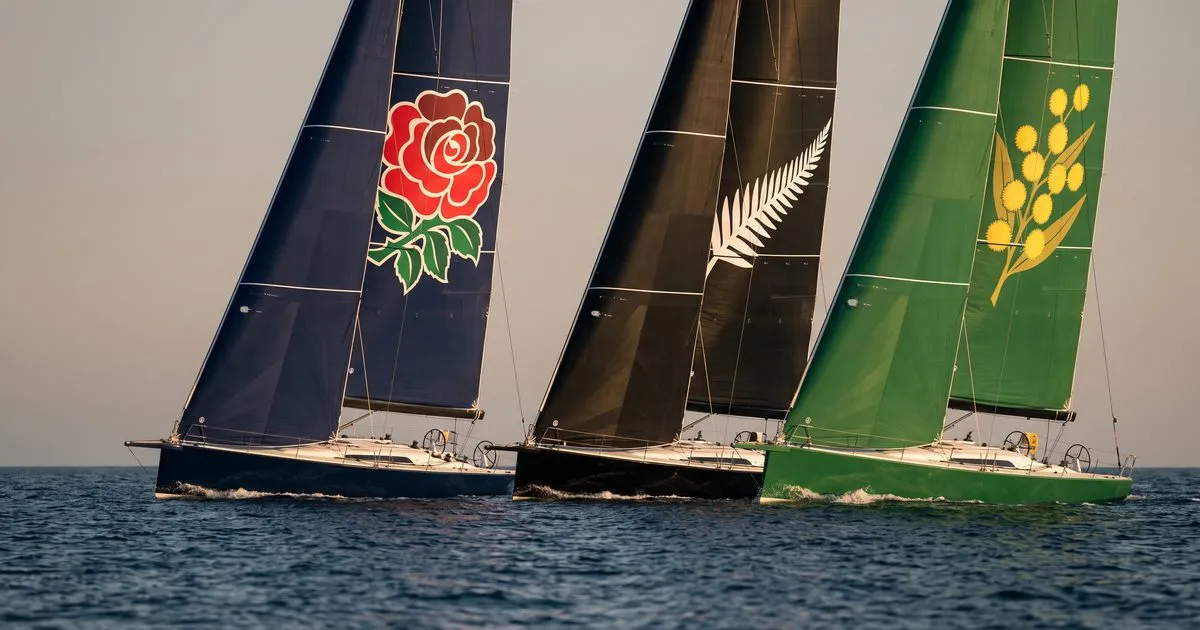
Australian super manages roughly 35 times as much money as KiwiSaver. You would expect the smaller system to charge more. On the latest independent comparison, it charges slightly less.
That is the headline from Deloitte’s 2026 benchmarking of KiwiSaver fees against Australian and UK pension systems, commissioned by Generate KiwiSaver. Deloitte compared a peer group of the largest providers in each country. We ran the same question across every open KiwiSaver fund. The finding holds, and the full market also shows where the higher fees sit.
What Deloitte measured
Deloitte compared total fees, excluding transaction costs, for members with balances of NZ$35,000 (close to the current average KiwiSaver balance) and NZ$50,000. In New Zealand its peer group was the six default providers and the largest choice providers, 11 providers in all. The data is current to 31 March 2026.
Deloitte split each system into default products, where members go if they never pick a fund (KiwiSaver default funds, Australia’s MySuper), and choice products, the options members opt into. A choice fund is any fund a member has actively chosen, whether on their own or with an adviser. At a NZ$35,000 balance, the medians were:
| System | Median total fee | Default products | Choice products |
|---|---|---|---|
| New Zealand (KiwiSaver) | 0.77% | 0.35% | 0.85% |
| Australia | 0.79% | 0.87% | 0.77% |
| United Kingdom | 0.32% | 0.30% | 0.32% |
Source: Deloitte, KiwiSaver Fees Benchmarking to Australian and UK Pension Systems, September 2026.
Behind those medians, the report makes three points about how KiwiSaver got here.
Default funds are where KiwiSaver wins clearly. New Zealand’s defaults cost less than half of Australia’s MySuper defaults. Deloitte attributes this to the government’s tender process and the mandated balanced asset allocation, against Australian defaults that hold more growth assets and more expensive unlisted assets such as infrastructure and direct property.
Choice funds have lost ground. Deloitte’s New Zealand choice median fell from 1.09% in 2022 to 0.86% in 2024, then barely moved, to 0.85%. Over the same two years Australia’s fell from 0.96% to 0.77%, driven by consolidation and APRA’s performance test. New Zealand’s is now the higher of the two, even after allowing for asset allocation and management style.
Passive pricing collapsed. Across all three systems, the median passive fee fell from 0.65% to 0.39%, which Deloitte links partly to the growth and repricing of low-cost passive providers in New Zealand.
The regulator’s own figures point the same way. The FMA’s KiwiSaver Annual Report 2026 puts total fees at about 0.7% of funds under management, stable for the last three years, and says the FMA will research recent trends in KiwiSaver provider fees this year.
The report looks at fees only. It does not assess performance, service or value for money, and lower fees do not by themselves mean a better outcome.
The finding holds across the whole market
KiwiSaver has 396 funds open to investment, holding about NZ$146 billion. Their latest fund updates, for most the quarter to 30 June 2026, give two ways to read the market. The median fund counts every fund once. The median holding weights each fund by its number of investors, so it shows what the typical member pays.
Like Deloitte, we compared multi-asset funds. The median holding is in a fund charging 0.78%, in line with Deloitte’s median, and the six default funds charge a median of 0.35%, the same as Deloitte’s figure.
Where the higher fees sit
The long tail
The median multi-asset fund charges 0.95%, well above the median holding. The gap comes from where members sit:
| Multi-asset funds, by number of investors | Funds | Share of holdings | Median fund |
|---|---|---|---|
| Largest 10% | 26 | 63% | 0.60% |
| Next 15% | 39 | 25% | 0.79% |
| Next 25% | 66 | 10% | 1.04% |
| Smallest half | 132 | Under 2% | 1.03% |
Source: Nuvano’s analysis of publicly disclosed KiwiSaver fund data, fund updates to 30 June 2026. Includes default and lifecycle stage funds.
The same pattern shows by provider. Deloitte’s 11 providers are also the largest by funds under management, holding 90% of KiwiSaver money. The 22 schemes outside that group charge more:
| Multi-asset choice funds | Schemes | Funds | Holdings | Median holding |
|---|---|---|---|---|
| Deloitte’s 11 providers | 12 | 118 | 2.90 million | 0.81% |
| All other schemes | 22 | 139 | 0.36 million | 1.12% |
Source: Nuvano’s analysis of publicly disclosed KiwiSaver fund data, fund updates to 30 June 2026. Excludes default and single-sector funds. ANZ runs two schemes, so 11 providers run 12.
Smaller schemes are not automatically worse value. Some offer specialist strategies, active management or service that a large provider does not. But a peer group of the largest providers, the right tool for comparing countries, describes most of the money, not every member.
Wrap funds, where one provider offers another manager’s fund under its own scheme, add a further layer of cost wherever they sit: the 80 in the market have a median total fund charge of 1.15%. The wrap layer section of NZ KiwiSaver 2026 Landscape: Fees, Performance, and the Data looks at that premium in detail.
Growth-seeking members pay the most
The more growth assets a fund holds, the more its members tend to pay. In high-growth multi-asset funds, the median holding is 1.05%, against 0.56% in conservative funds.
| Growth category (multi-asset choice funds) | Funds | Median holding | Holdings in funds above 1% |
|---|---|---|---|
| Conservative (under 40% growth assets) | 72 | 0.56% | 8% |
| Moderate (40% to 60%) | 43 | 0.80% | 24% |
| Growth (60% to 80%) | 57 | 0.95% | 24% |
| High Growth (over 80%) | 78 | 1.05% | 59% |
Source: Nuvano’s analysis of publicly disclosed KiwiSaver fund data, fund updates to 30 June 2026.
The spread within high growth is wide. In Deloitte’s combined data for all three systems, the high-growth fee range widened from 1.60 to 2.15 percentage points between 2024 and 2026, as low-cost passive options pulled the bottom down. In KiwiSaver, 24% of high-growth holdings are in funds charging 0.60% or less, and 59% in funds charging more than 1%.
The step from default to choice
The default funds hold about 10% of fund holdings. Everyone else is in a choice fund, and the median holding in a multi-asset choice fund is 0.85%, against 0.35% in a default fund. On a NZ$50,000 balance, that is about NZ$425 a year instead of about NZ$175. Deloitte’s figures show the same step.
What this means for KiwiSaver members
Your fee is not the system median. It is the total fund charge of the fund you are in, and that figure is in your fund’s latest fund update. If you have moved out of a default fund into a choice fund, check what you now pay: the typical choice fund costs more than twice as much.
A higher fee is not automatically wrong. As Deloitte notes, fees are only one part of value: a fund can earn its fee through returns, service or features that matter to you. What matters is knowing the number and why it is worth paying. How KiwiSaver fees actually work explains what sits inside the total fund charge and how to compare it.
What this means for advisers
The international comparison is good context for clients, and our full-market data supports it. Client reviews, though, happen fund by fund.
- Compare fees within the growth category. High-growth funds charge the most and vary the most, so a documented fee rationale carries most weight there.
- Say what a higher fee buys. A specialist strategy, active management or service can justify paying above the large-provider median. The advice record should say which.
- Moving a client off a default is a fee decision as well as an investment one. The step from about 0.35% to a typical 0.85% to 1% should be part of the advice record.
- Read the date on the fee. A fund update reports actual charges for the fund’s last financial year, so a fee change can take up to a year to show in full.
- Value, not just price. Fees are on the FMA’s agenda this year, and with transfers between schemes up to 5.3% of funds, it expects members to get clear, balanced information and access to advice when they move. The 2026 KiwiSaver landscape analysis sets out five questions for an annual review of each placement.
Deloitte’s conclusion is that KiwiSaver remains competitively priced against much larger international peers. Across the whole market, that holds for the typical member. Whether it holds for a particular client depends on the fund they are in.
How we did the analysis
- Data: publicly disclosed fund data for every KiwiSaver fund open to investment (396 funds, 34 schemes). Figures come from each fund’s latest fund update, to 30 June 2026 for 371 funds and to 31 March 2026 for 15 that report annually. Fund size and investor numbers are as at those dates; fees are each fund’s actual charges for its last financial year.
- Fee measure: total annual fund charge as disclosed in each fund’s latest fund update, which reports actual charges for the fund’s last financial year. It includes management, performance and other fees and costs, and excludes flat dollar membership fees. Deloitte used fee schedules from product disclosure statements, current to 31 March 2026, and included flat dollar fees, which it found on 41% of New Zealand choice funds at an average of NZ$11.40 a year. The two measures are close but not identical.
- Median fund and median holding: the median fund counts each fund once. The median holding weights each fund by its number of investors; a person with two funds counts twice, so holdings (3.95 million) exceed members. The multi-asset median holding stays between 0.70% and 0.80% when the largest one to five funds are removed, so no single fund sets it.
- Fund types: comparisons use multi-asset funds, as Deloitte did. We also include lifecycle stage funds, which are multi-asset. Single-sector funds such as cash or single-asset share funds are left out.
- Providers: Deloitte’s New Zealand peer group is ANZ, ASB, AMP, BNZ, Booster, Westpac, Generate, Fisher Funds, Milford, Simplicity and SuperLife, which are also the 11 largest providers by funds under management. They run 12 schemes, because ANZ’s OneAnswer KiwiSaver Scheme is still registered separately; we count it under ANZ, as Deloitte does.
- Check against Deloitte: on Deloitte’s 11 providers, counting each multi-asset fund once, our data gives a median of 0.81% overall, 0.83% for choice funds and 0.35% for default funds, against Deloitte’s 0.77%, 0.85% and 0.35%. The small gaps reflect the different fee sources described above.
- Default funds: the six funds offered by the appointed default providers.
- Growth categories: multi-asset choice funds, by each fund’s actual asset allocation (seven funds with no allocation data are left out), using Deloitte’s bands. We count listed and unlisted property in full as growth assets and leave “other” assets out; Deloitte counts unlisted property at 75% and alternatives at 50%.
- Ranges: we quote medians and shares rather than extremes, because a small number of funds report figures that look like disclosure errors.
Sources
- Deloitte, KiwiSaver Fees Benchmarking to Australian and UK Pension Systems, prepared for Generate KiwiSaver, 8 September 2026, as reported by Generate Wealth.
- Financial Markets Authority, KiwiSaver Annual Report 2026, September 2026.
- Nuvano’s analysis of publicly disclosed KiwiSaver fund data, October 2026.
Disclaimer: The information in this article is general in nature and is not intended as personalised financial advice. It does not take into account your individual financial situation, goals, or needs. Before making any financial decisions, seek advice from a licensed Financial Advice Provider. Past performance is not a guarantee of future returns. Fund and fee figures are based on Nuvano’s analysis of publicly disclosed KiwiSaver fund data, using fund updates to 30 June 2026, and on Deloitte’s report as cited. Nuvano Limited is a technology provider to Financial Advice Providers and does not provide financial advice directly to consumers. © Nuvano Limited. Reproduction or redistribution of this article, in whole or in part, requires prior written permission.
Get our latest insights
New articles on KiwiSaver, fees, and fund selection delivered to your inbox.

Rajat Vats
Nuvano
Founder of Nuvano. Practising financial adviser and former portfolio manager, with experience across custodial operations and adviser workflow platforms in New Zealand.
LinkedIn

